The Battle of Waterloo is considered one of the defining moments in European history. On June 18, 1815 the armies of Field Marshall, the Duke of Wellington and Napoleon met close to Waterloo (today known as Belgium). This battle marks the end of Napoleonís reign as the Emperor of the French.
The Reign of Napoleon
In 1799 Napoleon took control of the French government and in 1804 he became the emperor. Due to a series of wars, he was able to expand his empire all across central and western Europe. However, after a rather disastrous invasion of Russia during 1812, as well as several other defeats, he was exiled in 1814. In 1815 Napoleon returned to France and he regained power for a brief period of time. During the Battle of Waterloo, the forces led by Napoleon were defeated by both the Prussians and British, which signified the end of his reign of power as well as the domination France held in Europe. Once the battle was over, he abdicated and then, several years later, died while in exile.
Understanding the Battle
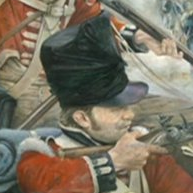
The Battle of Waterloo was fought between volunteers who were loyal to the dictator Napoleon, and a gathering of armies that included the Prussians, Hanoverians, Dutch and British, as well as troops that hailed from Brunswick and Nassau.
While the soldiers serving under Napoleon were definitely outnumbered by the Coalition army, at 73,000 to 118,000, they had past experience under their belt, while the troops serving under Wellington, were ñ in the manís own words ñ extremely ill-equipped and weak. This is because the majority of troops in Britain had already been sent over to the U.S. in order to fight in the War of 1812. The cavalry led by Wellington was extremely inexperienced and had no backup to call upon.
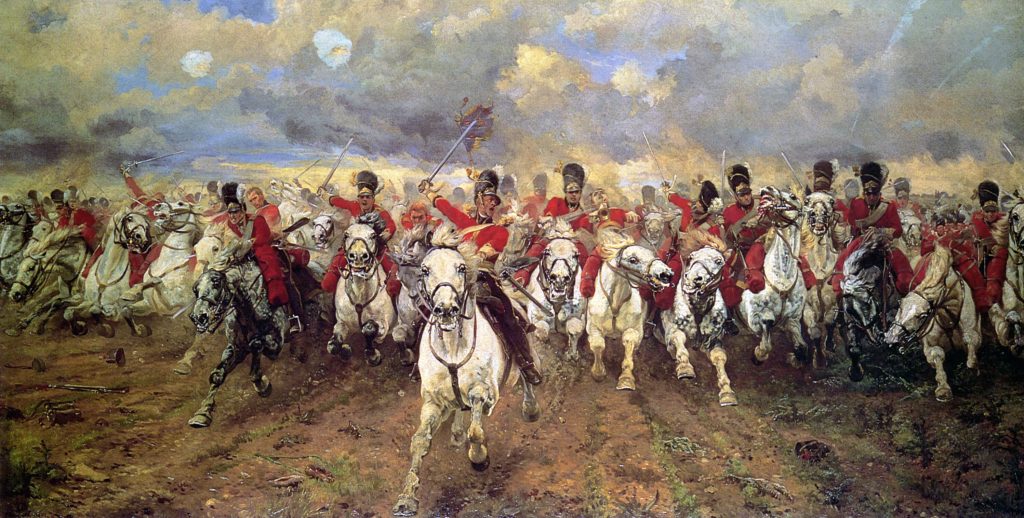
The 40,000 troops from Prussia had been routed by the army led by Napoleon 48 hours before the battle, which means they did not arrive to fight until early in the evening. This prompted the famous saying from Wellington of ìnight or the Prussians must come.î
The Arrival of the Prussians
The Prussians did arrive and by the time 8:30 in the evening arrived, the French army, led by Napoleon had been defeated. After the battle, Wellington described the entire event as the ìnearest run things you ever saw in your life.î During the battle, approximately 12,000 horses and 44,000 men lost their lives or were wounded. Approximately one month later, Napoleon surrendered while on board the HMS Bellerophon. This surrender occurred on July 15th of the same year.
The Legacy of this Infamous Battle
The battle of Waterloo marked the end of the Napoleonic era. The battlefield is now home to Lionís Mound in Belgium and was erected by King William I from the Netherlands. This actually marks the spot where the kingís son, the Prince of Orange, became wounded while the battle was going on.
Today in Britain, Waterloo is still considered part of day to day life. There are parks, pubs, streets and a train station that have been named after the battle, as well as the combatants including Wellington. Even some companies in the United States have borrowed from the battle’s illustrious history.
The Final Years of Napoleon
Napoleon was abdicated, again, on June 22 in 1815. In October of that year, he was exiled to the remote island of Saint Helena, which was British held and located in the southern part of the Atlantic Ocean. At age 51 on May 5 in 1821 Napoleon died and most people believe this was due to stomach cancer. He was buried on the island, but in 1840 the remains were dug up and sent back to France. At this point they were entombed at Les Invalides in a crypt in Paris, where there are other French military leaders buried.